

Does a new Top Chef statistic change who the GOATs are?

I’m not much of a sports person, but I have so much respect for sports statistics. Now, I can’t take credit for this new Top Chef statistic I’m introducing - all credit goes to my partner. His love of baseball inspired this, and then we talked about what the Top Chef equivalent would be.
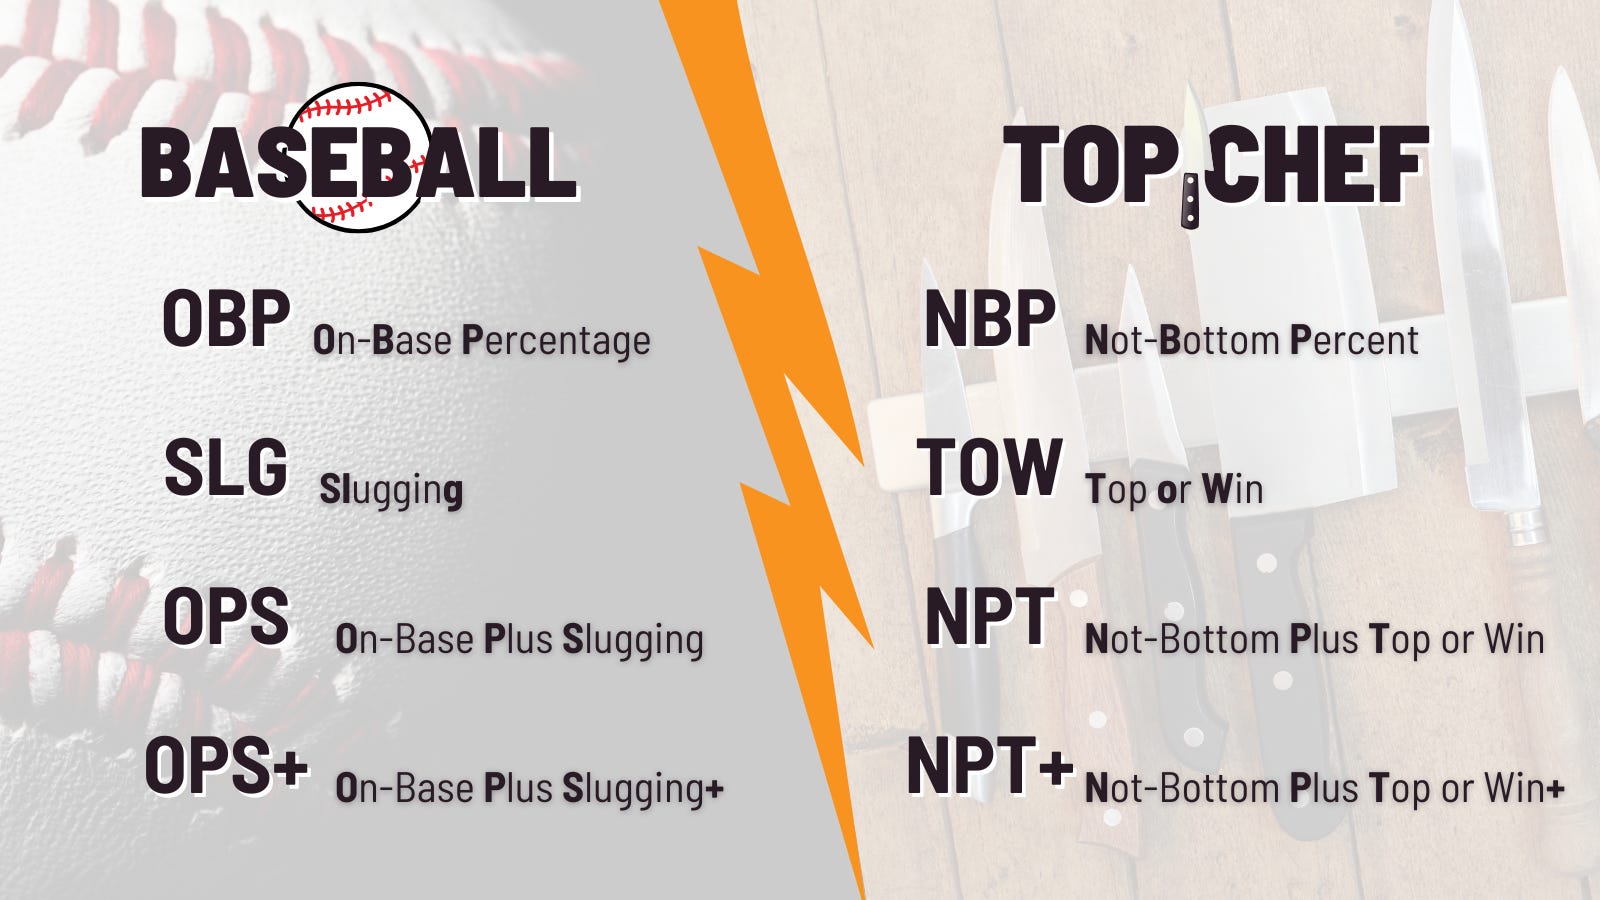
Quick sidebar about some baseline statistics: On-base percentage (OBP) is how frequently a batter reaches a base per plate appearance. Slugging percentage (SLG) is the total number of bases a player records per at-bat. OPS combines these two metrics: On-base percentage Plus Slugging percentage. Then, OPS+ takes OPS and normalizes it across the whole league.
By modifying these statistics for Top Chef, it fixes the current problem I have with comparing seasons using my methodology. My methodology requires the same number of Quickfire and Elimination challenges, and so I can only say things such as: “Up to and through 12 Quickfire challenges and 10 Elimination challenges, so-and-so had the best score.” The metric assumes that everyone competed in that number of challenges, when that is not the case (e.g., people who were eliminated prior to 10 elimination challenges would have less opportunity to contribute data).
What this new statistic will do for Top Chef is that it will not only account for the percentage of time chefs win, but also for how frequently they continue on in the competition. With the exception of the final elimination challenge, it’s actually okay for chefs to not win a challenge - they just need to not lose. This is something that many of you already take into account in your fantasy leagues. This new statistic will allow us to now compare that across seasons.
So! Let’s get into it.
What challenges are included: Elimination, Quickfire, Sudden Death Quickfire, and Quickfire Elimination. I decided to exclude qualifying challenges because it sort of feels like Spring Training in baseball: it’s definitely a game/challenge, but it doesn’t count towards season statistics.
NBP (Not bottom percentage) is the Top Chef equivalent of OBP. Just because a baseball player got on base doesn’t mean they got a homerun, but it does mean they’re moving forward. So this will be the number of times a chef was NOT in the bottom of a challenge or eliminated divided by the number of challenges.
TOW (Top or win percentage) is the Top Chef equivalent of Slugging. It’s how far they got per at-bat. This will be the number of times that they were at the top of or won a challenge divided by the number of challenges.
NPT (Not bottom Plus Top or win) is the Top Chef equivalent of OPS. It adds up NBP and TOW, combining how well they can move forward in the Top Chef season with their ability to do well.
NPT+ (Not bottom Plus Top or win Plus) is the Top Chef equivalent of OPS+. It takes into account the “league” average (where all of Top Chef US is the league) of each of NBP and TOW. An NPT+ score of 100 is the league average; a score of 150 is 50% better than league average. A difference between NPT+ and OPS+ is that OPS+ is the league’s average for a specific year. However, because there are hundreds of players in an MLB year, and only 12-18 in a Top Chef season (year), I decided to have the Top Chef league average be across all seasons in order to reduce statistical noise. (Note that people’s NPT+ will change slightly as new seasons are aired.)
NPT+ = [(NBP/league average NBP) + (TOW/league average TOW) - 1] * 100
“Uh, what? Carly, I like Top Chef, not math,” you might be saying to me right now. An example to make this more concrete is comparing two chefs from Season 22: Tristen Epps and Bailey Sullivan. Tristen rates super high in NPT+ with 289 because he almost never stumbled into the bottom 3 and routinely played himself into the top like ice cubes in a cocktail glass - he has a high NBP and high TOW, compared to the average Top Chef contestant. His NPT+ is interpreted as him being 189% better than the average chef on Top Chef. Compare that to his fellow finalist, Bailey, whose NPT+ is 28. She was in the bottom much more frequently than average (a low NBP) and in the top less frequently (a low TOW). You can interpret her NPT+ as being 72% worse than the average chef on the show (but she was a finalist, so I’m definitely not knocking her skills as a chef).
Now let’s compare with my previous GOAT list. These four chefs met three of the four criteria I laid out in that list (in chronological order of when the season aired): Stefan Richter (Season 5), Brooke Williamson (Season 10), Gregory Gourdet (Season 12), Buddha Lo (Season 20).
Buddha’s Season 20 performance remains at the top because of his NPT+ (277); it’s ranked 4th. He is 177% better than the average Top Chef contestant.
Brooke was incredibly strong in both her seasons. In my previous list, the reason that her Season 10 performance was on the GOAT list and not her Season 14 performance was that in Season 10, she won both a quickfire and an elimination challenge in two episodes. For the NPT+, however, it’s her Season 14 performance that shines (her NPT+ is ranked 6th, compared to her Season 10 NPT+ with a rank of 37).
Stefan’s Season 5 NPT+ (210) is ranked 25th; he is 110% better than the average Top Chef contestant.
Gregory’s Season 12 NPT+ is ranked 31st (192); he is 92% better than the average Top Chef contestant.
Other ways people talk about Top Chef GOATs is simply the percent of challenges they won, regardless of challenge type. Melissa King is often referred to as one of the GOATs because she has the best win percent: .410. However, with the NPT+, she drops to a rank of 19. Brooke Williamson (Season 14) and Buddha Lo (Season 20) tie for the second highest win rate (.375); their NPT+ is listed above. An even starker difference between rank of win percent and NPT+ is Paul Qui (Season 9) and Kevin Gillespie (Season 17), who have the third and fourth highest win rates; they have the same NPT+ and it is ranked 35th.
Time to peruse the NPT+ data yourself! To reduce the size of the table, I’ve limited this to those who finished in 6th place or better. There are a handful of chefs who did better than chefs listed here who had very high NPT+ but were eliminated when there were more than six chefs in the competition. For example:
Lee Anne Wong (Season 15) tops the list with an NPT+ of 463. She was only in one challenge in that season, but was in the top performers of that challenge. Both her NBP and TOW are 1.000. When she withdrew from the competition, she earned 10th place in the competition.
Spike Mendelsohn (Season 8) ties with Tristen Epps at #1 with an NPT+ of 289. He competed in eight challenges and finished in 14th place in that season.
Jackson Kalb (Season 19) has the 9th ranked NPT+. He finished 9th in his season, so is not included in the table below.
I feel vindicated that I’ve been saying Richard Blais is a GOAT - he’s in the Top 10 twice. And we can see that Tristen Epps kicked ass in the most recent season. Buddha Lo in Season 20 was chef’s kiss. And then Seasons 14 and 20 each have two chefs in the top 10!
Tristen on Mt Rushmore confirmed